
Diversification and Correlation
it is not what you think

We love the idea of diversification in mitigating risk and providing a smoother return path. When we talk about diversification we think about correlation. But what if what we think about correlation and what we get from correlation are much less helpful in delivering the diversification that we are looking for? This is the case and there is better way to bring diversification into a portfolio when we care the most, when asset prices fall.

One of the few things we know in Finance is that diversification can be a good thing. If an insurance company insured only one person for home, auto, health, and life they might get lucky – the person’s home never burns down, they never have a car accident, they are the picture of health and they live to be 100 and drop dead on their daily 10 mile walk. Or they might get unlucky – the person’s home burns down when they crash their car into the gas water heater, suffer extensive burns and head trama, live for 3 years and many surgeries including organ transplants and then die at age 38. But insurance companies insure many people in many ways to diversify their exposure.
Similarly in your portfolio – you could hold all your assets in a single company and you might get lucky and have picked the next Apple, Amazon or Google or you might be unlucky and have invested in Virgin Atlantic, Organigrams, or Pets.com. Most of us don’t just invest in one stock, we hold many and not just US stocks, but non-US stocks, maybe some bonds, some real estate, some commodities, …. We diversify our portfolios in the hopes that everything that we invest in does not fall at the same time. This brings us to the notion of correlation. Correlation is something we all use, calculate and talk about but it is like the line from the Princess Bride – “You keep using that word. I do not think it means what you think it means.”
The goal of this paper is to establish what correlation is so that we can be more clear about what it is not. I will suggest that what we want, not all of our assets to fall at the same time, and correlation have less to do with each other than you might think. I will encourage you to step away from 6 decimal point accuracy in estimating correlations and lean harder into just getting the sign right in certain states of the world. In doing this I will encourage you to get off autopilot and think. Leaving autopilot and thinking might be the best investment decision you make. To do this I am going to do a tiny bit of math. If that is frightening then just skip the equations and read the words. You won’t miss a thing.
Correlation
Where

is the correlation between two things, x and y,

is the covariance between x and y,

is the standard deviation of x and

is the standard deviation of y
Correlation is a measure of the relationship between two things and because it scales the covariance by the product of the standard deviation of the two things it is bounded to lie between +1 and -1 inclusive. That is important because it makes correlation easy to interpret. Covariance being unscaled is very hard to interpret. But because correlation must lie between -1 and +1 inclusive we immediately have a sense of what a correlation of -0.8 vs 0.4 means. The cost of this ease of interpretation is that correlation throws away the magnitude. Two series can have a correlation of 0.3 even if one series is 10x more volatile than the other series or is half as volatile. Covariance gives you a clue about volatility but correlation does not. So correlation gives you no sense as to how much of one asset to hold to help diversify against another asset.
Let’s peel the onion one layer deeper. What is the covariance between x and y?
Where
is the average of x over the period from t=1 to t=T and

is the average of y over the period from t=1 to t=T.
Notice the similarity between the equation for the covariance and the equation for the average, both add up a bunch of stuff and divide by the number of things that were added up. This tells us that the covariance is the average relationship between x and y, the average co-deviations from their respective averages. This is important! Correlations, because they are derived from covariances, tell us about the average relationship between two things over the period that the correlation is measured. Averages can hide what matters most to us. Did you hear about the man who drowned crossing a river with an average depth of 1 foot?
Stock and Bond correlations
One of the most common places investors seek diversification is between stocks and bonds. Let’s look at that relationship through time using the S&P 500 and 10-year US Treasury bonds. The data are daily and run from Jan 1983 through April 2026. What is graphed below is the rolling 60-day correlation between stocks and bonds. The areas shaded in green are periods where the S&P 500 is in drawdown on the way to losing 10% or more. We can make a couple of points about this
1) We can safely say that the correlation over this period tended to be between +1 and -1 which is comforting since by definition it must be. It had a max of 0.79 and a minimum correlation of -0.80. In other words it spanned almost the entire permissible space. Not very helpful in making a guess as to what it will be over some period in the future.
2) The average of the rolling correlations was -0.03 and the full period correlation was -0.11 but the rolling correlation spent very little time near either of these values. This makes it difficult to assign an expected future correlation between stocks and bonds. We can see the past but what we care about is the future. Think of a country where the temperature is 80F for half the year and is -80F for the other half. The average temperature is zero but if you prepare for that you will either sweat to death or freeze to death.
3) We also see that it can change from its current level very quickly. This also makes forecasting future period correlations very difficult.
4) We see periods where the correlation was positive at the start of the drawdown and negative by the end. And periods where it was negative at the start of the drawdown and positive by the end. More on this in the table below.
A summary of these points is that if we care about the correlation between stocks and bonds, history is unlikely to be a reliable guide to the future, especially if we care about it most in periods of equity market drawdown.
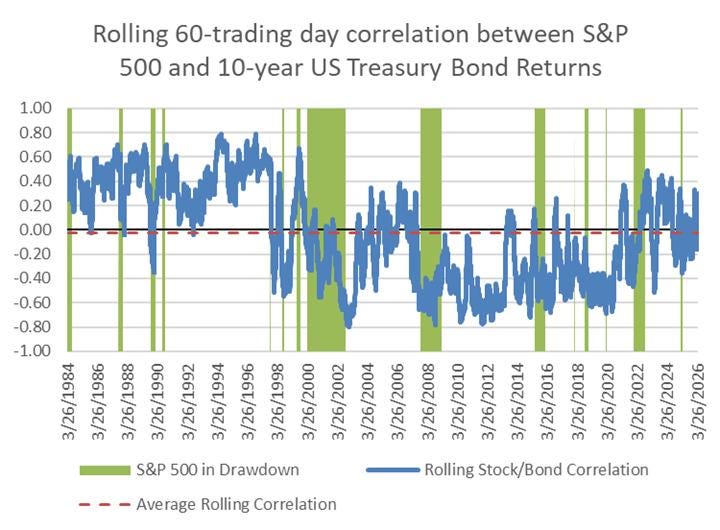
Source: Jan 3, 1984 – Apr 28, 2026. S&P 500 price levels https://www.wsj.com/market-data/quotes/index/SPX/historical-prices, 10-year US Treasury Bond Yields https://fred.stlouisfed.org/series/DGS10 used to calculate par bond returns, authors calculations
When we think about diversification we think about negative correlation. But that is not really what we want. We are greedy. We want positive correlation when stocks are doing well and negative correlation only when stocks are doing poorly. So what we really care about is not the average relationship between two assets over time. What we probably care most about is the relationship between the two assets during periods of market stress and this depends on the stressors. For a moment release the fixation on nailing down correlation to 2 or more decimal places and let’s focus on getting the sign right.
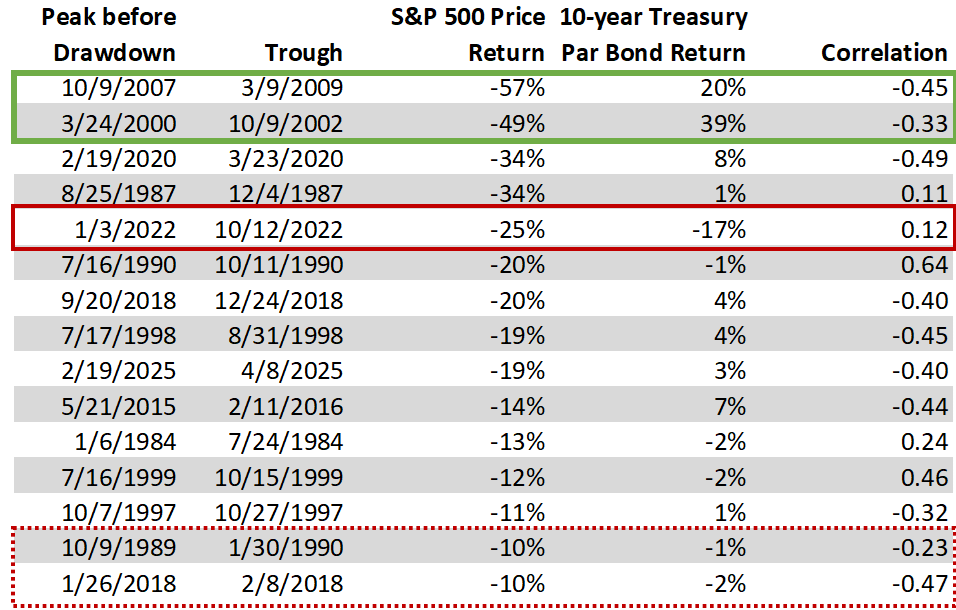
Below is a table of the US equity market drawdowns in excess of 10% over the period Jan 1984 – Apr 2026 sorted from largest drawdown to smallest. The first column is the date just prior to the start of the drawdown. The next column is the date of the low point of the drawdown (the periods between these two dates is shaded green in the graph above). The next two columns provide the price return to the S&P 500[1] during the drawdown and the total par bond return to 10-year Treasuries during the S&P 500 drawdown. The final column is the correlation between stocks and bonds during the drawdown
Source: Jan 3, 1984 – Apr 28, 2026. S&P 500 price levels https://www.wsj.com/market-data/quotes/index/SPX/historical-prices, 10-year US Treasury Bond Yields https://fred.stlouisfed.org/series/DGS10 used to calculate par bond returns, authors calculations
From the table we can see that for the two largest equity drawdowns in this period (outlined in green) bonds did an amazing job producing strong positive returns to help offset the massive equity drawdowns. The story was not so encouraging during the drawdown in 2022 (outlined in red) where stocks were down 25% and 10-year US Treasuries fell 17%. It is comforting that the correlation is negative in the periods in the green outline and is positive in the period in the red outline but it creates unease to see a negative correlation in the last two rows of the table (outlines in dotted red) where both stocks and bonds fell. In the table there are 15 drawdowns. In 10 of them the stock bond correlation was negative and in 5 of them stocks and bonds were positively correlated. On average over these 15 drawdowns stocks fell by 23% and bond rallied by 4%. On average bonds helped but not very much. Seems correlation is a fickle friend and we might not even be able to count on it after the fact.
A simple framework
Might we be better able to get what we want from correlation forecasts, getting the sign right, with a simple framework? What I find extremely helpful is to consider four macro drivers:
1. Real economic growth,
2. Real interest rates,
3. Inflation, and
4. Investor sentiment
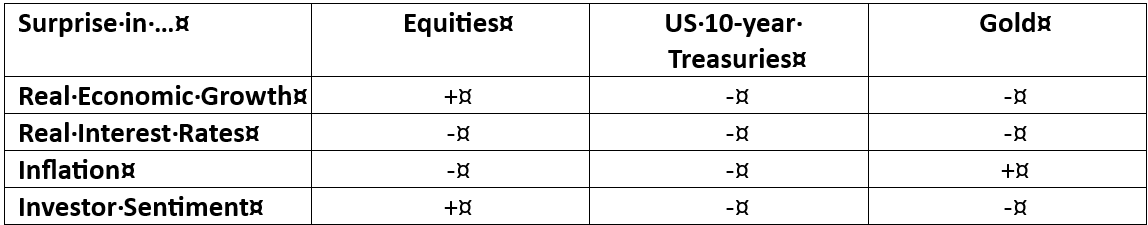
and ask the question, “What happens to various asset classes when we get a positive (positive in this case means larger than expected, not that you like it) surprise to each of these factors all else equal. Once we have that what can we say about the likelihood of each macro environment and what does that tell us about the likelihood that the two assets will be diversifying or not. Below we provide several examples to try to make this more clear.
The way to read the table below is given a positive (bigger than expected) surprise in one of the macro factors in the first column the sign of the asset class return is given in the next three columns. For example, if real economic growth is greater than expected we would expect that equities have a positive return while bonds and gold both fall, all else equal.
Source: author
What we can see from the table is that when real economic growth and/or investor sentiment are likely to be the primary drivers of asset returns in the near future then the correlation between stocks and bonds is likely to be negative. If, however, you are concerned about interest rates and/or inflation then stocks and bonds are not likely to be very diversifying. Gold is likely to be diversifying to stocks except when interest rate changes are driving returns. And gold is only diversifying to Treasuries when inflation is the prime concern.
Looking ahead
How do I see the world on May 12, 2026 in the middle of the Iran war stalemate, US real economic growth in Q1 2026 of 2%, the Fed Funds rate targeting 3.50%-3.75%, Brent Crude at over $102/barrel, month over month inflation running at an annualized rate of 7.2% for headline US CPI and 4.8% for core CPI (excluding food and energy), an unemployment rate of 4.3%, stock markets hitting fresh highs, consumer sentiment (University of Michigan) at its lowest point in the last 50 years… This is only a guess. This is not investment advice.
1) Real economic growth – I see potential for slowing across many sectors offset by support from AI buildout and spending on defense. I don’t expect any significant changes here.
2) Real interest rates – the fed is going to be in a tough spot with a desire to lower rates but inflation data that suggest tightening and no need to support the strong labor market. I don’t expect much action here.
3) Inflation – The pressure here is to the upside from the war, fuel costs, tariffs, and reduction in immigrant labor. AI may push in the opposite direction by replacing many of us and forcing us into the fields to pick the crops, build the houses, wait on the tables, drive the taxis, clean the hotel rooms, … that the immigrant workforce used to tend to. I expect the most surprises to come from inflation.
4) Investor sentiment – It is interesting that stocks are hitting new highs while consumer sentiment is hitting new lows. The data on the rising delinquencies in consumer debt suggest that these two will move toward convergence with an equity market correction.
So my best guess is that inflationary pressure builds and forces an interest rate response. We will see something that rhymes with 2022. The size of the interest rate response is unlikely to be anywhere near as large as in 2022 but more impactful given it will start from a much higher base and the continued effects of higher interest rates since 2021 take their toll. I expect equity bond correlations to be positive or more importantly I expect that bonds will not provide much diversification in an equity market drawdown. Gold will prove a more effective diversifier.
Conclusion
Forecasting correlations is very difficult – often both the sign and the magnitude are challenging. Correlations capture an average relationship but often what we care most about is not the average relationship but the relationship in certain future states of the world. We might be better served by thinking about what future states of the world are we most concerned about or are most likely to occur and then ask the question what assets are diversifying in those states of the world? It is likely to be better to be directionally correct than precisely wrong.
[1] The longest history of S&P 500 data I could obtain was for price returns only and it begins 1/3/1984. I have total return data beginning 2/1/1993. Calculating stock/bond correlations using these two different stock return indices beginning 2/1/1993 and comparing the two gives an R-squared of 0.9963 with an intercept of 0.0027 and a slope coefficient of 0.993. There is no meaningful distortion in this analysis from using price returns in place of total returns.